PHOTOMICROMETER 1D/2D (announcement)
Articles 27-12-2021, 21:56 1 219 print
PHOTOMICROMETER 1D/2D (PMC) – A SIMPLE DEVICE FOR MONITORING CRACKS FROM PHOTOGRAPHS
(announcement of the new system)
(announcement of the new system)
1. INTRODUCTION
The Photomicrometer 3D photogrammetric system has been released in 2019 and has already established itself as an effective automated tool that allows to remotely perform high-precision monitoring of cracks and deformation seams along three coordinate axes. Today, the system is successfully used by dozens of organizations in Russia and other countries. At the same time, as marketing research shows, there is a demand for a simpler and more budget-friendly solution based on the same principles. In this article, we present such a device and it-based photogrammetric crack monitoring technology, which is planned to enter the market in the coming months.
2. METHOD
The monitoring technology includes marker, digital camera and processing software PhotoMicrometer C.
The markers can be of two types: for one-dimensional (PMC-1D) and two-dimensional (PMC-2D) determinations (Fig.1).
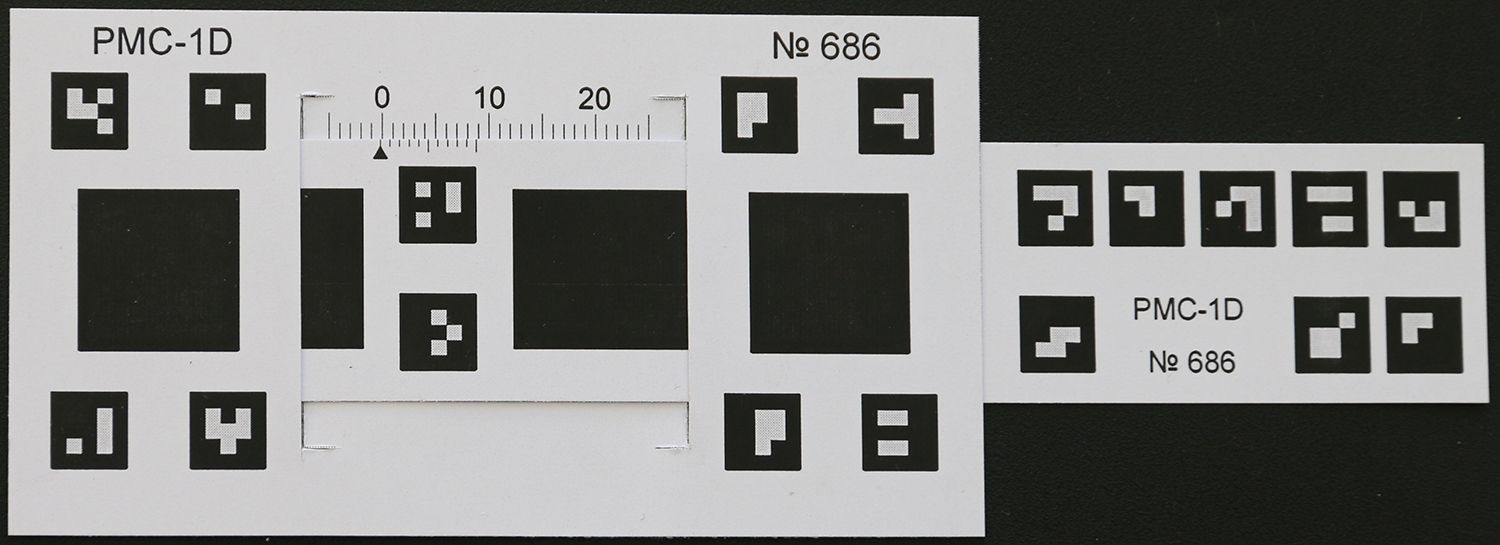
Fig.1.1. PMC markers for one-dimensional measurements

Fig.1.2. PMC markers for two-dimensional measurements
2.1. PMC marker and its operating principle
We will present the device and the operating principle of the marker on the example of a simpler model.
The PMC marker (PhotoMicrometer Contrast) consists of two plates made of white plastic with a thickness of 0.5 - 0.8 mm. On both the plates there are printed Aruco marks and measuring areas of black color, designated C1, C2, C3 and C4 in Fig.2.
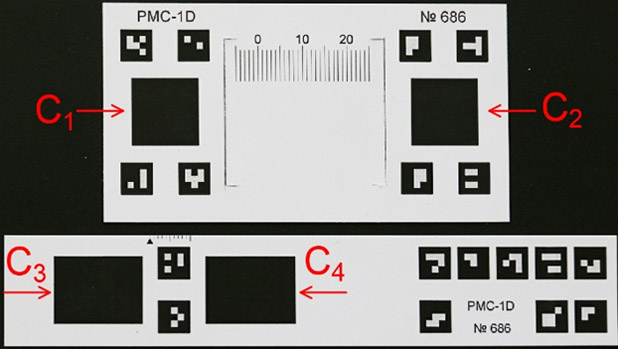
Fig.2. Wide and narrow marker plates with the designation of measuring areas.
All areas have the same height, and С1 and С2 have the same width also. In this study, a marker with the dimensions of a wide plate of 50x90 mm was tested, and the dimensions of areas C1 and C2 were 15 mm.
To monitor the crack, the marker is installed as shown in Fig.3.
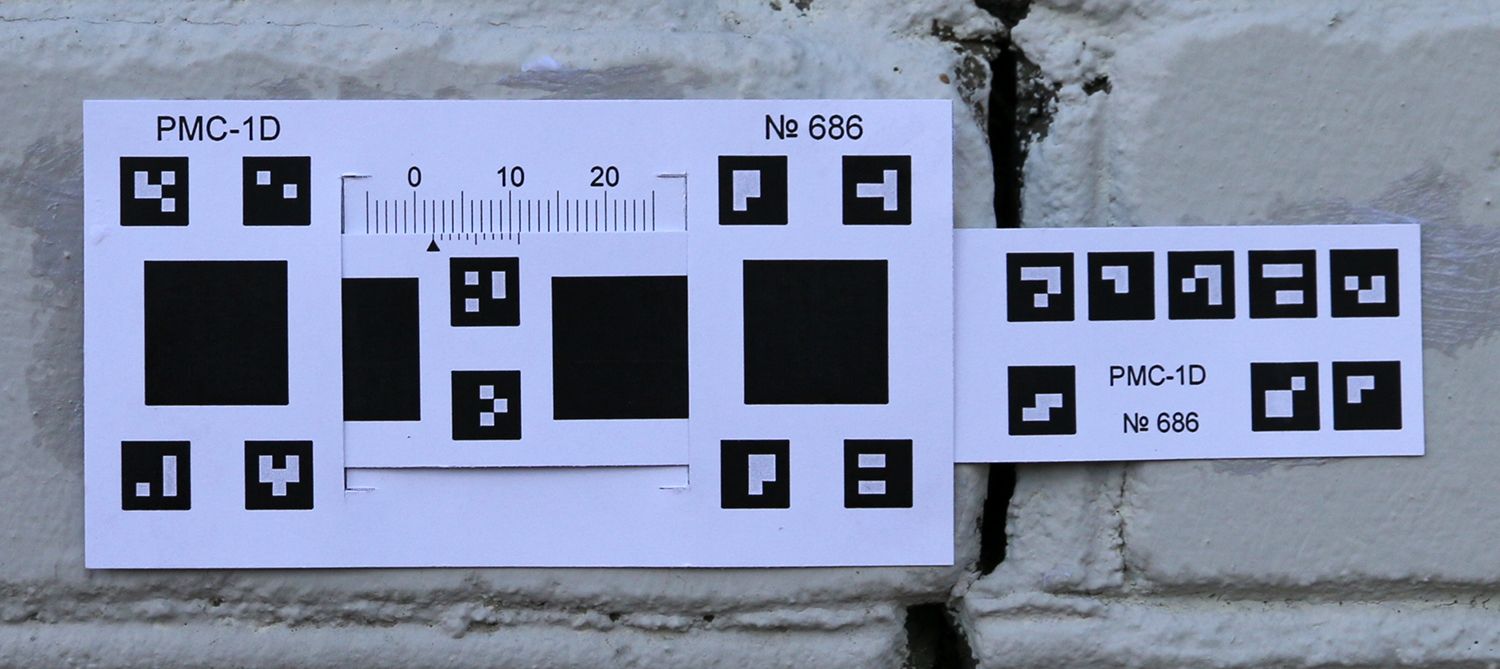
Fig.3. Installing a crack monitoring marker
As it can be seen in the figure, the wide plate has slots where the narrow plate is threaded in such a way that parts of the measuring areas C3 and C4 get hidden under the wide plate. Wide and narrow plates are fixed (glued) on different sides of the crack under study.
The principle of the marker operation is that when the crack width increases (decreases), the width of the visible part of the areas C3 and C4 will change. At the same time, the width of areas C1 and C2 does not change and their dimensions are used as reference. The current position and the size of the measuring areas can be fixed by photographing the marker. And using the known initial sizes of the C1 – C4 regions in millimeters and the dimensions of their images measured in pixels in the image, it is possible to accurately determine the current width of the C3 and C4 areas in millimeters, even without resorting to complex photogrammetric calculations.
2.2. Digital camera
Any digital camera can be applied for monitoring by the PMC marker. When choosing a camera for monitoring, an important requirement is the ability to take detailed pictures from different distances, so it is convenient to use telephoto lenses with variable focal length and telecompact cameras.
2.3. The software PhotoMicrometer C
The software PhotoMicrometer C (Fig. 4.) was specially developed to operate with the markers of this design and allows to perform fully automated processing of images from mark measurements up to the creation of monitoring reports.
The main functions of the program are as follows:
- uploading a photo(s) taken during the current monitoring cycle and automatically finding the marker image in the photo(s);
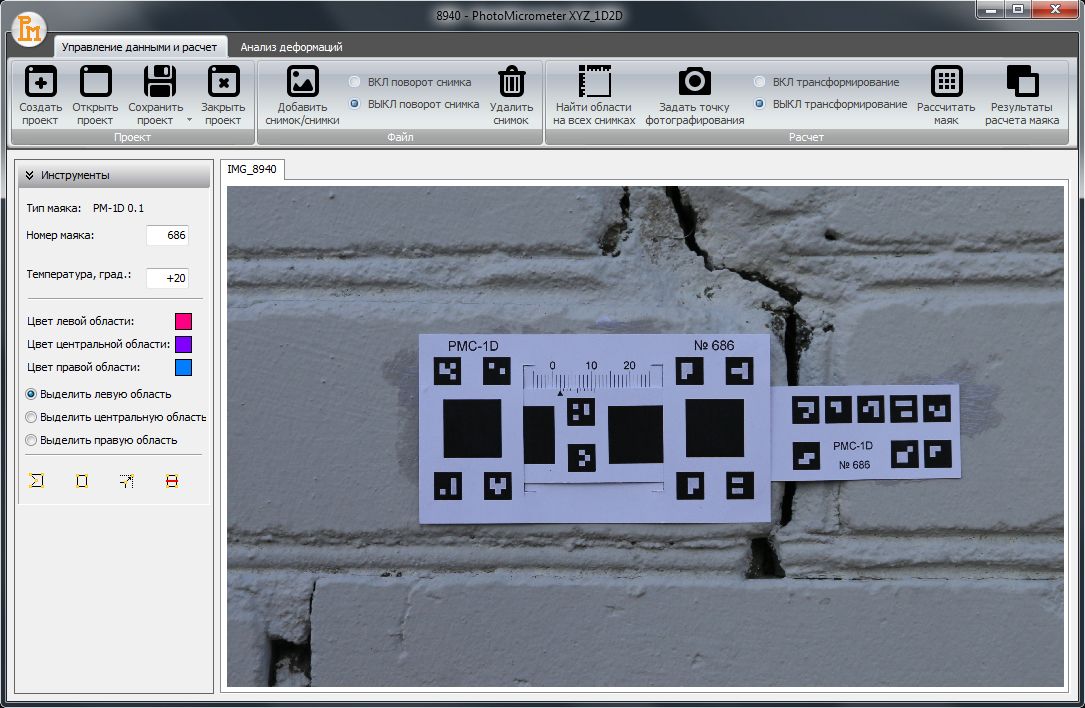
Fig.4. The Interface of the Photo Micrometer C software.
- automatic identification of the marker number, automatic recognition of measuring areas C1 - C4 by the position of Aruco marks;
- binarization of the image of measuring areas C1 - C4 and counting the number of black pixels in each area (Fig.5);
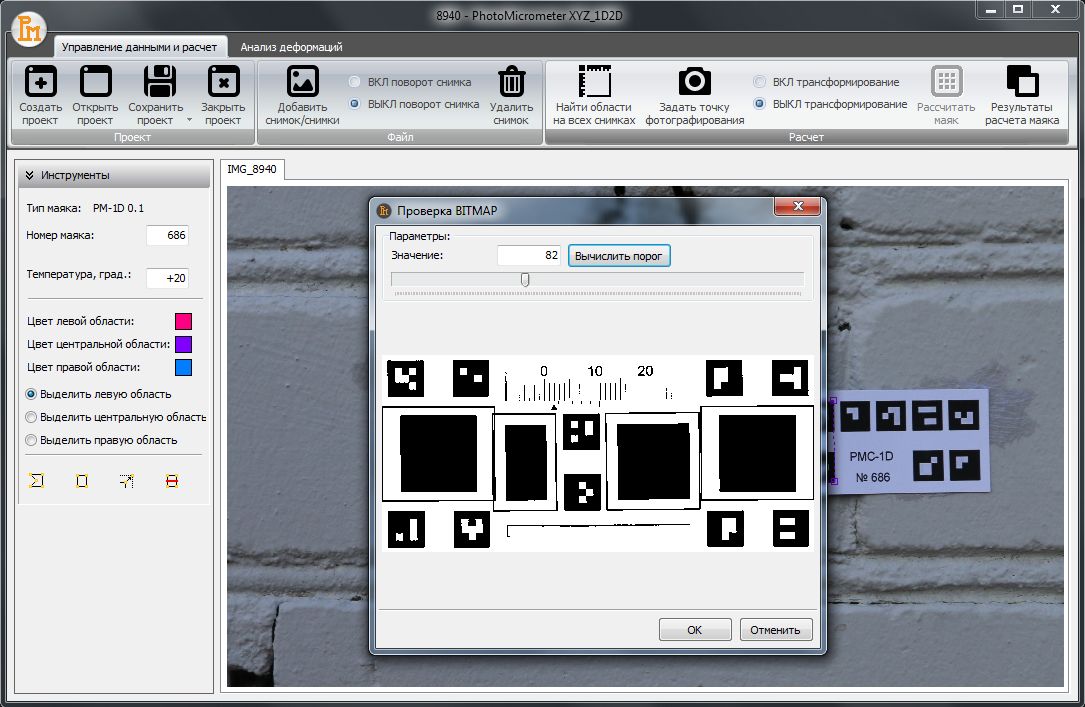
Fig.5. Recognition of measuring areas and counting the number of black pixels in each area.
- calculation of the variable X for the monitoring cycle and evaluation of accuracy:
[center]
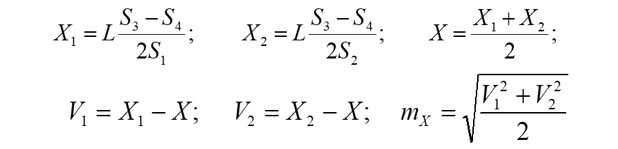
Where Si – the sum of the black pixels of the i-th measuring area Ci, automatically calculated by the software in the marker image after its binarization; L – the real width of the areas С1 and С2 in millimeters.
If the observations in the cycle consist of several photos (n), then the variable X and the standard error mx are calculated as follows:
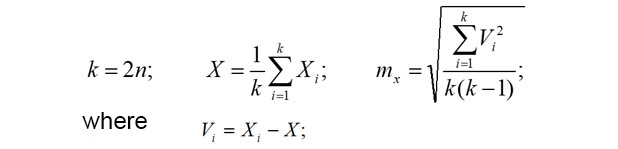
If there are results of several cycles of marker observations, the software calculates the differences ∆ between the variables X of each cycle and the initial one. The differences reflect the dynamic of the crack at the marker installation site. Monitoring results can be displayed in the form of tables and graphs.
3. TESTS, MAIN RESULTS.
The functioning of the system was tested according to the following criteria:
- the effect of distortion on measurement results;
- the effect of photographing distance on measurement accuracy;
- the effect of the photographing angle on the measurement results.
3.1. Study of the effect of distortion on measurement results.
A number of studies have been conducted to determine the effect of distortion on the results of measurements and definitions, and the main conclusion can be formulated as follows:
- if you do not use wide-angle optics and photograph from a distance of more than 1 meter, the effect of distortion will be insignificant and will be less than the accuracy of the measurements and definitions performed.
3.2. Study of the effect of photographing distance on measurement accuracy.
For this study, the marker was fixed on a mechanical micrometer with a scale division price of 0.01 mm. The marker was photographed by the camera Nikon Coolpix P900 sequentially from distances of 2, 10, 20, 30, 40 and 50 meters. Then an imitation of the crack opening by 0.5 mm was performed on the micrometer scale, and the photographing was repeated in reverse order. As result, 5 images were taken at each position. The processing results are shown in the graph (Fig.6). As you can see on the graph, the shift of 0.5 mm is clearly legible, and the maximum spread of values is observed at a photographing distance of 50 m (the amplitude is 0.13mm, the mean square deviation is 0.048 mm).

Fig. 6. A graph of the relative position of the two plates relative to the initial one based on the results of processing images taken from different distances.
The results of this and a number of other studies suggest that the system reliably ensures the accuracy of definitions of 0.05 mm at photography distances from 1 to 50 meters.
3.3. Study of the influence of the photographing angle on the measurement results.
For this study the marker with a constant position of the measuring areas was photographed at different angles of inclination and rotation. As the research results have shown, the system gives stable results at vertical angles of photographing inclination from -60 to +60 degrees and different angles of rotation in the plane of the wall. At the same time, the angle of horizontal rotation begins to render a systematic effect starting from a value of 20 degrees. Thus if you follow the restrictions recommended in the photographing angles, you can get monitoring results with an accuracy of 0.05 without resorting to photogrammetric calculations and transformations. If it is not possible to withstand these restrictions, then the PhotoMicrometer C software has a function for the images transforming (Fig. 7).
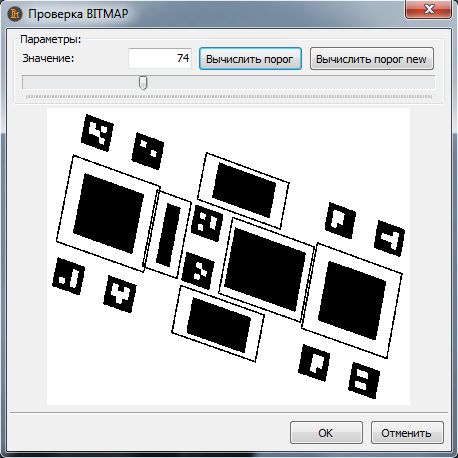
Fig. 7. Measurement of the original (left) and transformed (right) images.
The program implements an algorithm of reverse photogrammetric serif (RPS), which allows to theoretically strictly calculate three Eulerian angles for orienting the main photographing ray relative to the coordinate system of the marker. The transformation of the images (Fig. 7) is performed on the angles found from the RPS solution. The use of this algorithm allows to expand the processing capabilities of these images, but also imposes some additional requirements on the quality of the markers manufacturing.
Summing up, we can say that the presented system allows monitoring the size of crack opening with an accuracy of 0.05 mm, at shooting distances up to 50 meters and at different shooting angles, using single images.
Using the PMC-1D and PMC-2D beacons shown in Fig. 1, it is possible to perform automated monitoring on both one and two coordinate axes.
In addition, the PMC-1D marker has a scale with a vernier, which allows you to manually take a count with an accuracy of 0.1 mm, and makes it possible to use this device as a conventional mechanical crack-meter without using photographs and photogrammetry methods, which can sometimes be useful.
The release of the Photomicrometer 1D/2D system is planned at the beginning of 2022.