PHOTOGRAMMETRIC TECHNOLOGY FOR REMOTE HIGH-PRECISION 3D MONITORING OF CRACKS AND DEFORMATION JOINTS OF BUILDINGS AND CONSTRUCTIONS
Articles 30-03-2021, 12:21 5 731 print
A.E. Wojnarowski 1,2, A.B. Leonteva 1, S.V. Tyurin 2, S.G. Tikhonov 1, O.V.Artemeva 2
1 PHOTOGRAMMETRIA Research and Production Enterprise, St. Petersburg, Russia - info@photogrammetria.ru
2 Saint Petersburg State University, Department of Cartography and Geoinformatics, St. Petersburg, Russia - a.vojnarovsky@spbu.ru, s.tjurin@spbu.ru, o.artemieva@spbu.ru
ABSTRACT:
Monitoring of cracks and deformation joints of buildings and engineering constructions can be performed effectively using contemporary methods of photogrammetry. Our study allowed us to design the technology for such a monitoring. This technology is adapted for use by building operation and building inspection specialists and does not require special knowledge in photogrammetry. The monitoring equipment includes two blocks of photogrammetric deformation marks, a digital camera and processing software. Each block of deformation marks is designed as a plate of 60 by 40 mm size where several dozens of marks are fixed (size of the plate and number of marks may vary). The relative positions of the marks on the plate are determined while block calibration with an accuracy of several microns. While monitoring is performed, two blocks of deformation marks are fixed on both sides of the crack or deformation join. Then marks are photographed. Almost any digital camera is suitable, beginning with smartphone camera and ending with specialized photogrammetric camera. Further processing of collected imagery is performed on the basis of rigorous methods of photogrammetry (specialized software were developed). The processing assumes automatic identification and measurement of marks on digital photographic images with sub-pixel accuracy. Additionally, the photogrammetric calibration and distortion correction are performed for each image. Three-dimensional spatial solution is possible both in the case of single image processing, and in the case of stereopair processing. The dynamics of crack development in three dimensions is determined by the results of several cycles of observations collected over period. Our technology allows to ensure the accuracy of the coordinates and deformations at the level of 0.005–0.020 mm for the photographing distances from 0.1 to 40 m.
1. TASK POSING
An important task of engineering inspection of buildings and engineering constructions is to monitor the dynamics of cracks and expansion of deformation joints. Different types of tools and different principles are used to solve this problem. These can be simple gypsum markers, mechanical or electronic sensors, surveying instruments, photogrammetric devices.
Gypsum markers (Fig.1) allow only to detect the fact of the crack development, but when using them, we can not say anything about the quantitative characteristics of this process.
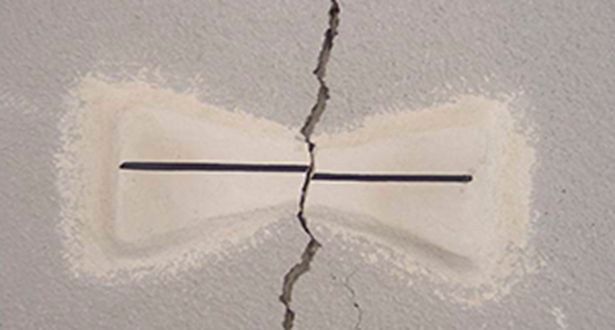
Figure 1. Example of gypsum marker
Other types of sensors are mechanical or scale-based crack measurers (Fig.2). Depending on the design, these sensors can provide accuracy in the range from 0.5 to 0.01 mm. A serious drawback of these devices is that the measurements samples have to be collected manually.
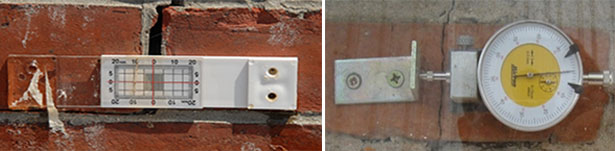
Figure 2. Example scale-based and mechanical crack measurers
The second drawback is the inconvenience of using of the crack measurers at a considerable height from the ground or at a distance from the observer, since each time it is necessary to use stairs, towers or other devices to collect measurements.
The electronic linear motion sensors most effective (Fig.3). These devices provide highest accuracy (up to several microns and above), while automated measurement collection allows to implement a permanent monitoring system. However, due to the high cost the electronic sensors are used, as a rule, to monitor only the most important and dangerous objects in the most responsible spots.
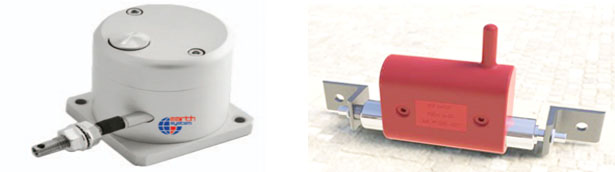
Figure 3. Examples of electronic linear motion sensors
Another disadvantage of the both sensors is their capability to track the only movement direction (usually perpendicular to the direction of the crack or join). Consequently, if it is needed to monitor deformations in three-dimensional space, we will have to install one sensor for each coordinate axis; that leads to rising of complexity and cost of the monitoring system.
Regarding to the use of geodetic methods, it is necessary to use expensive precise instruments and, as a rule, quite complex and time-consuming measurement techniques in order to ensure ~0.1 mm accuracy of the measurements (a typical requirement in crack monitoring). Therefore, geodetic methods are rarely used for such a monitoring.
The disadvantages of all above mentioned devices and techniques force to elaborate other approaches to solve the problem. In recent years, more and more research and development activities are devoted to the use of the photogrammetry methods. However, a large number of studies are focused on the use of photogrammetric techniques for the detection and measurement of cracks (Hampel, Maas, 2009; Rau et al., 2017; Sarker et al., 2017; Valença et al., 2013; Zheng, 2014), and only a small number of investigators consider the use of photogrammetric approach for the crack monitoring purposes.
Some proposed solutions (GEOSEC, 2019) provide 0.1 mm accuracy, and appears as an essential replacement for scale-based and mechanical sensors, while others provide 0.01 mm accuracy, but require photographing in tight to the object (WELTWAVE, 2019). A serious study photogrammetry applications to the crack detection, measurement and monitoring is given by Barazzetti and Scaioni (Barazzetti, Scaioni 2009).
In our study, we were focused on development of the photogrammetric monitoring methods for cracks and deformation joints and on conversion this methods into ready-for-use technology.
Before the start of the research (in 2015), we formulated basic principles used as a basis of the technology of photogrammetric crack measurer:
1. The technology is developed for survey engineers and operation engineers, and it should not require a high level of photogrammetric knowledge
2. Non professional digital cameras have to be applicable for the imagery collection, without restrictions
3. High accuracy have to be ensured by high resolution of collected imagery, high-precision technique of deformation marks measurement, and rigorous methods of photogrammetric processing
4. All the complexity of photogrammetric image processing have to be highly automated and hidden behind graphical user interface of the developed software
As a result of four years of research, development and experiments, we have become able to develop a photogrammetric system that allows remote high-precision monitoring of cracks and deformation joints in a three-dimensional coordinate system and complies with the above principles.
2. THE COMPOSITION OF THE PHOTOGRAMMETRIC CRACK MEASURER
The photogrammetric crack measurer (or crack measurement system) incorporates marker (composed of two blocks of photogrammetric deformation marks, which are fixed on both sides of the deformation join or crack), camera and processing software.
2.1. Marker
Each of two blocks of photogrammetric deformation marks is designed as 60 by 40 mm size aluminium plate with a relief stair, each contains several dozens of measurement marks (Fig.4). The size of the plate is chosen so that it can be placed on one brick.
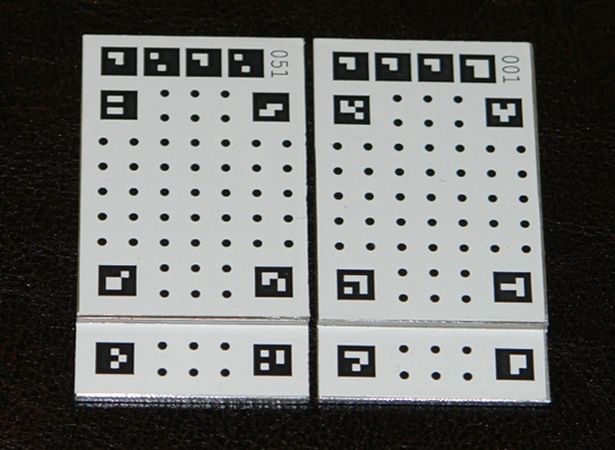
Figure 4. Relief marker with code marks
In addition to the measurement marks, a number of code marks is placed on each plate. The code marks are recognized by the processing software automatically and allow the program to detect the mark number, and then to find and apply the marker calibration parameters when accomplish photogrammetric processing of imagery.
Calibration of the marker
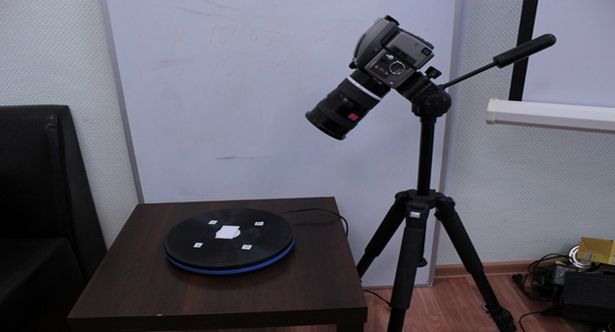
Figure 5. Calibration of the block of photogrammetric deformation marks
Calibration of the marker assumes determination of the marks’ coordinates using stereophotogrammetric method. The calibration is made preliminary in the laboratory using a high-resolution camera and a turntable (Fig.5). The mark coordinates accuracy of 2-3 microns is obtained as a result of the spatial phototriangulation adjustment.
Thus, each of the two blocks of marks fixed on both sides of the crack has its own coordinate system (Fig.6) and, as a result, the problem of crack monitoring is reduced to the determination (using photogrammetric methods) of the elements of mutual orientation and changes-in-time parameters for the coordinate systems of the left and right plates.
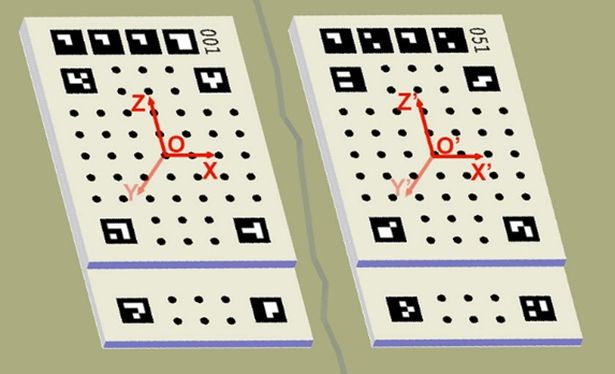
Figure 6. The coordinate systems of the blocks of photogrammetric deformation marks
2.2. Camera
Conventional digital cameras or camcorders can be used for shooting. It is important that the camera have to allow to get an high resolution image at the selected photographing distance. There is no requirement for the preliminary calibration of the camera. Every image of marker collected during the monitoring is calibrated when undergoing the photogrammetric processing. The calibrated coordinates of the marks are used as reference data.
2.3. Software
To ensure the use of photogrammetric crack measurer by specialists that have no (or almost no) knowledge in photogrammetry domain, we developed PhotoMicrometer software that can be used for photogrammetric processing of collected imagery in almost completely automated mode.
3. HOW DOES THE PHOTOGRAMMETRIC CRACK MEASURER WORK?
It is possible to monitor cracks with the help of the photogrammetric crack measurer basing both on single image and on stereopair using stereophotogrammetric method.
3.1. Single image measurements
When applying single-image technique we have to collect one image of marker for each epoch of observations (Fig.7).
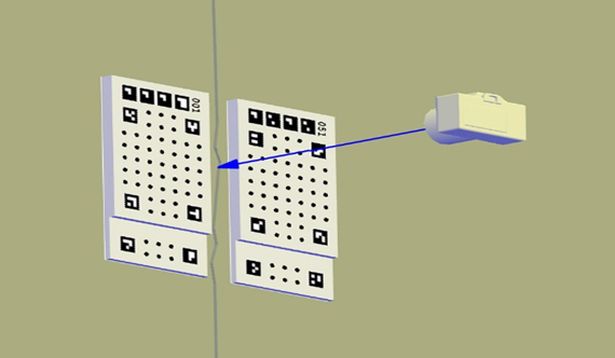
Figure 7. Single image photographing
Using code marks, the processing program determines the accounting numbers of marker plates and finds previously determined and stored marker calibration parameters. Then the measurement marks are detected on the plates automatically, and their photogrammetric coordinates are determined with high accuracy (0.05 pixels). Using these data, the program performs a further computations basing on the Inverse Photogrammetric Resection (IPR) algorithm. The computations are conducted in a number of stages. At the first stage, the IPR is solved with additional parameters, such as distortion parameters and elements of internal orientation. In this case, each image is considered as two images (separately for left and right plates) made by one camera. The results of the marker calibration are used as reference data. Such an approach avoids the need of preliminary camera calibration and gives to the user a freedom in photographing as then his main task is to get a high-quality image. The second stage takes into account computed values of distortion parameters and angular orientation elements. At the third stage, three-dimensional linear elements of the mutual orientation of the right and left images and accordingly center positions of two blocks of the marks are determined with high accuracy. Changing of the mutual orientation elements in the next era in comparison with the initial values will characterize the mutual movement of the blocks of marks.
Thus, even using single images it is possible to carry out three-dimensional monitoring.
A significant disadvantage of single image use is that as the camera moves away from the marker due to the deterioration of the geometry of spatial IPR, the accuracy computations is degraded rapidly. Our experience has shown that the effective photographing distance is the distance between 0.05 and 0.3 m.
3.2. Stereophotogrammetric method
When applying the stereophotogrammetric method, photographing is performed from two or more positions (Fig.8).
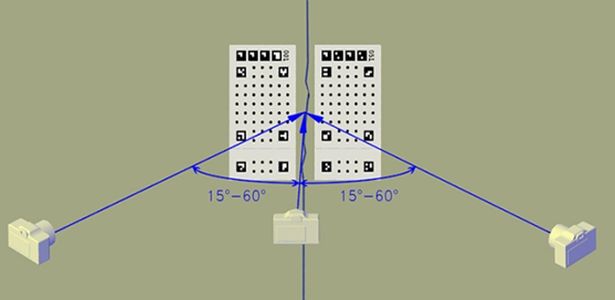
Figure 8. Stereophotogrammetric photographing
Processing of the imagery is performed similarly to a single image with the only difference at the third stage. Computation of mutual orientation elements of the left and right plates is conducted commonly for all the images through the solution of a single system of linear parametric equations. As our study have shown, use of stereophotogrammetric method allows to perform measurements in three-dimensional space with 5 to 20 microns accuracy at 0.1 to 40 meters photographing distances. The limitation in this case is the use of a camera that allows to collect imagery with the required resolution.
3.3. Control of computations and accuracy estimation.
Both in the cases of single image processing and stereophotogrammetric processing, a large number of redundant measurements are presented. This enables to provide least squares adjustment of photogrammetric measurements, to control absence of gross errors, and to estimate the accuracy of results. Thus, the end user can assess the accuracy and reliability of the results immediately and can draw conclusions on satisfaction of produced results or on need of measurement improvement, by increasing the number of images or changing the photogrammetric network geometry, for example.
3.4. Automation of monitoring
All the described actions are hidden from the end user and performed automatically. The processing software allows to perform:
1. Automatic detection and identification of the marker on the image
2. Automatic detection and measurement of marks (Fig.9)
3. Solution of photogrammetric resections and image calibration
4. Computation of the relative positions of the coordinate systems on left and right blocks of marks with accuracy assessment (Fig.10)
5. Estimation and visualization of deformations for several observation cycles and formation of monitoring report (Fig.11)
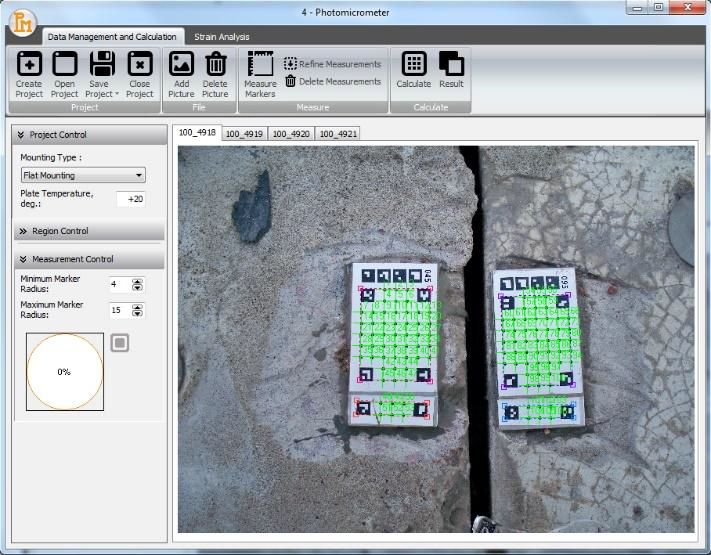
Figure 9. Automatic measurement of the marks
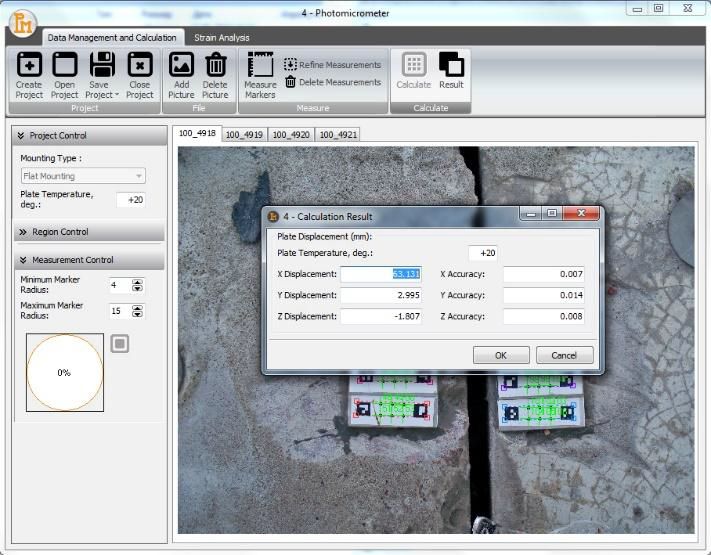
Figure 10. Computation of the relative position of the blocks of marks, accuracy assessment
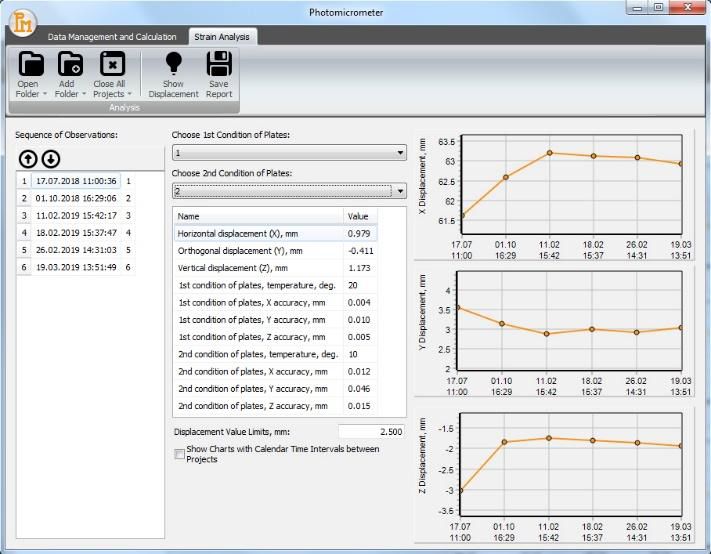
Figure 11. Computation and visualization of deformations over several observation cycles
4. TESTING OF CRACK MEASURER
To test the designed technology, we used a test object mounted on a three-axis mechanical micrometer with 0.01 mm scale division (Fig.12). Photographing was carried out by Nikon Coolpix P900 digital camera. This is a compact camera with 16 megapixel 1/2.3" size CMOS sensor, powerful telephoto lens and optical zoom. The equivalent (in terms of 36 by 24 mm frame size) focal length of the camera can vary from 24 mm to 2000 mm. This allows to use the camera for photographing at different distances and makes it a universal.
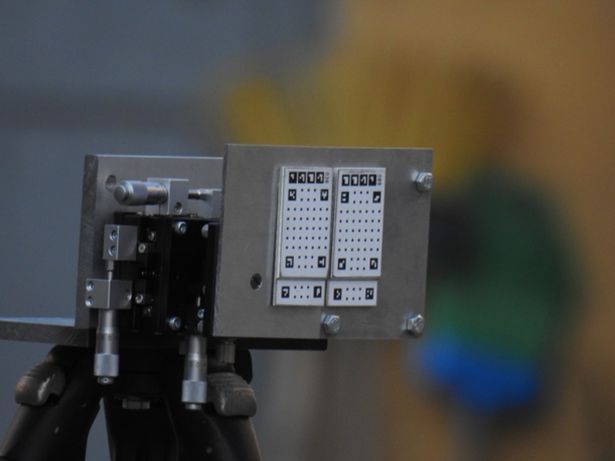
Figure 12. Three-axis micrometer with mounted marker of the crack measurer
4.1. Single image test
Single image processing was tested as follows. Photographing was carried out at the 0.1 m distance. The equivalent focal length of the camera was 24 mm. 14 images were taken. Then 0.2 mm magnitude shift was applied using micrometer to each of the three coordinate axes. After that, 14 images were taken again. The graphs of the right block of marks center position on three coordinate axes in the coordinate system of the left block of marks are shown in Fig.13.
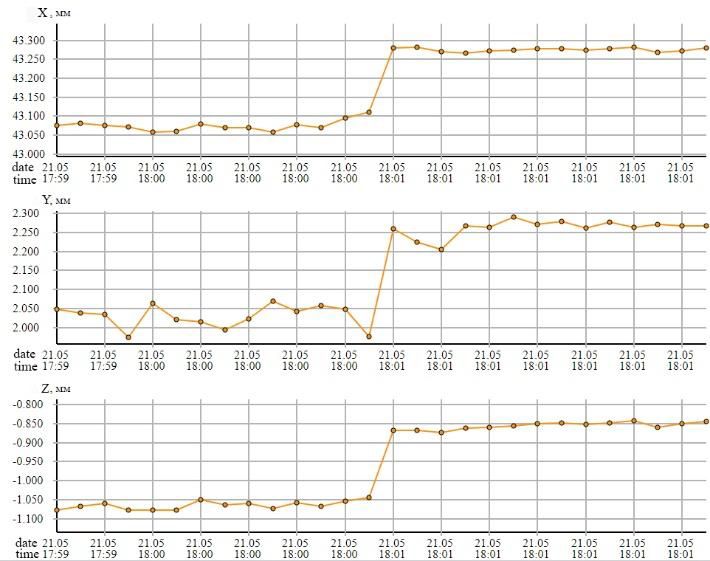
Figure 13. Relative X, Y and Z position graphs for the centers of two blocks of marks determined by single image processing
Average root mean square error (RMSE) of each measurement along the X-axis did not exceed 0.029 mm, and accordingly 0.086 mm along the Y-axis, and 0.018 mm along the Z-axis. Standard deviations estimated basing on 14 measurements were 0.009 mm for X-axis, 0.026 mm for Y-axis, and 0.010 mm for Z-axis. Corresponding offsets were 0.205 mm for X-axis, 0.232 mm for Y-axis, and 0.210 mm for Z-axis. Obtained results are clearly reflect the shift of marks performed during the photographing taking into account accuracies of the micrometer and of the photogrammetric measurements.
4.2. Stereophotogrammetric method test at different distances
Photographing was conducted from three positions (Fig.8). Convergence angles between lines of view were ~45° for pairs of adjacent and ~90° for two outer positions of the camera. Photographing was performed sequentially from 2 m, 10 m, 20 m, 30 m and 40 m distance. Five images were collected from each position of the camera. Then 0.2 mm micrometer shifts were applied along the three axes, and the photographing was repeated in the reverse order. The equivalent focal length of the camera at a 2 m distance was 500 mm, and 2000 mm at other distances. The graphs of the right block of marks center position in the coordinate system of the left block of marks are shown in Fig.14.
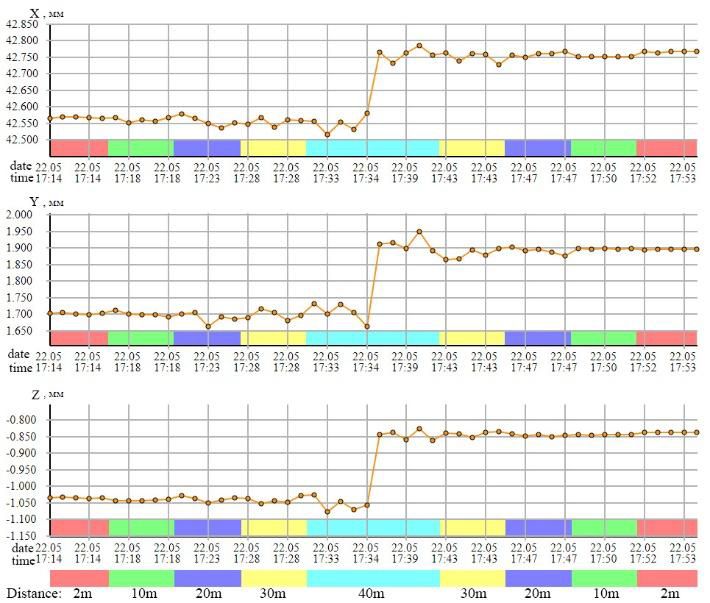
Figure 14. Relative X, Y and Z position graphs for the centers of two blocks of marks, determined by stereophotogrammetric method
As the graphs show, the error is grown with the grow of fotographing distance, while the minimal RMSEs are estimated at 2 m distance, and average values for the X, Y and Z axes are 0.003 mm, 0.004 mm and 0.002 mm accordingly. Maximal RMSEs correspond to the maximum (40 m) photographing distance, and their average values are 0.021 mm, 0.025 mm and 0.017 mm for X, Y and Z axes.
The graphs also reflect clearly the 0.2 mm micrometer shifts made along each axis. Shift estimations along the axes obtained from the stereophotogrammetric processing of collected imagery are presented in Table 1.
| Distance, m | ∆X, mm | ∆Y, mm | ∆Z, mm |
| 2 | 0.199 | 0.194 | 0.197 |
| 10 | 0.192 | 0.198 | 0.198 |
| 20 | 0.202 | 0.201 | 0.193 |
| 30 | 0.194 | 0.183 | 0.201 |
| 40 | 0.213 | 0.208 | 0.210 |
Table 1. Shift values estimated at different photographing distances
As the test results show, at different distances we obtain a correct and stable estimations of the applied shift.
4.3. Stereophotogrammetric method test at different angles
Photographing was conducted at 16 meters. The equivalent focal length of the camera was 2000 mm. Totally, 15 images were taken at different values of the Eulerian angles α, ω, κ, which are orienting the main axis of the photographing relative to the coordinate system of the left block of marks. The values of the applied angles for each image are shown in Table 2.
| Picture № | Angles, deg. |
| 07 | α =-1.205; ω =0.030; κ =1.941 |
| 08 | α =-1.870; ω =33.885; κ =2.502 |
| 09 | α =0.111; ω =-33.493; κ =2.337 |
| 10 | α =0.100; ω =-33.600; κ =2.313 |
| 11 | α =-50.818; ω =-23.5278; κ =-23.250 |
| 12 | α =-36.808; ω =-28.522; κ =-17.132 |
| 13 | α =29.973; ω =-15.246; κ =20.324 |
| 14 | α =50.175; ω =-22.333; κ=27.029 |
| 15 | α =44.523; ω =0.654; κ =1.418 |
| 16 | α =-46.379; ω =-0.102; κ =2.070 |
| 17 | α =-37.696; ω =25.241; κ =27.010 |
| 18 | α =-0.313; ω =33.845; κ =1.628 |
| 19 | α =50.455; ω =23.183; κ =-24.004 |
| 20 | α =-2.572; ω =54.785; κ =50.660 |
| 21 | α =-48.428; ω =-25.104; κ =67.062 |
Table 2. Values of image orientation angles (Eulerian angles) obtained as a result of photogrammetric processing of the images
To illustrate the photographing process, we present some of the images (Fig.15, Fig.16, Fig.17).
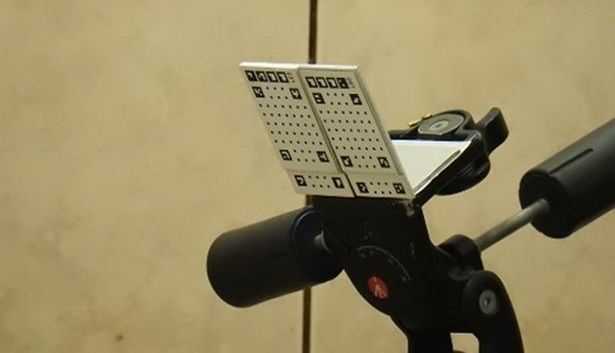
Figure 15. Image No. 11
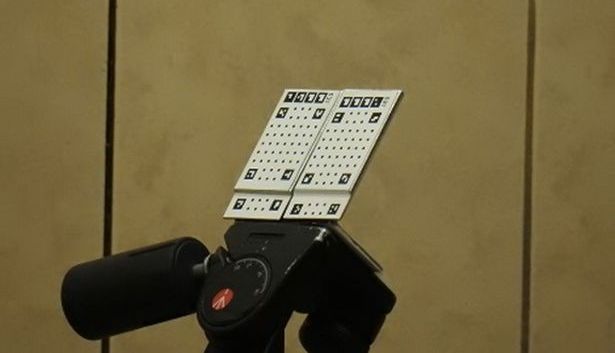
Figure 16. Image No. 17
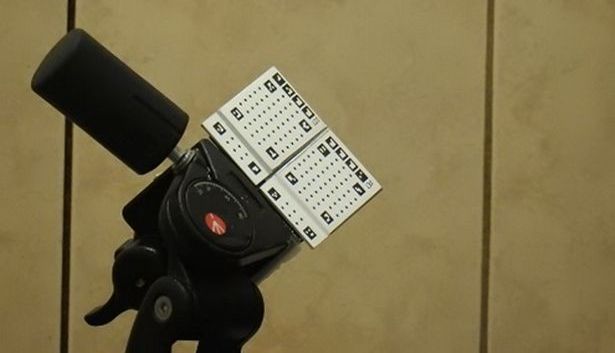
Figure 17. Image No. 20
Each data processing project incorporated 3 images collected at different Eulerian angles. The mutual position of the marks remained stable during photographing.
The results of imagery processing are given in Table 3. The project names composed by the numbers of images according to the Table 2.
| № | Project Name | ΔХ | ΔY | ΔZ | mx | my | mz |
| 1 | 07_08_09 | 39.573 | -0.093 | -1.665 | 0.003 | 0.006 | 0.003 |
| 2 | 07_11_14 | 39.585 | -0.072 | -1.657 | 0.003 | 0.004 | 0.003 |
| 3 | 08_12_13 | 39.575 | -0.069 | -1.652 | 0.004 | 0.005 | 0.004 |
| 4 | 09_11_13 | 39.572 | -0.070 | -1.666 | 0.003 | 0.005 | 0.004 |
| 5 | 10_12_14 | 39.579 | -0.078 | -1.651 | 0.005 | 0.007 | 0.006 |
| 6 | 10_17_19 | 39.577 | -0.089 | -1.653 | 0.004 | 0.004 | 0.003 |
| 7 | 11_16_17 | 39.590 | -0.083 | -1.654 | 0.005 | 0.004 | 0.002 |
| 8 | 14_15_19 | 39.582 | -0.081 | -1.648 | 0.006 | 0.005 | 0.002 |
| 9 | 15_16_18 | 39.587 | -0.079 | -1.651 | 0.003 | 0.003 | 0.002 |
| 10 | 16_07_20 | 39.583 | -0.075 | -1.660 | 0.002 | 0.004 | 0.002 |
| 11 | 17_18_19 | 39.587 | -0.085 | -1.649 | 0.003 | 0.003 | 0.003 |
| 12 | 21_09_17 | 39.578 | -0.072 | -1.661 | 0.005 | 0.006 | 0.005 |
Table 3. Computed relative positions of the blocks of marks and their standard deviation
The greatest difference between the estimated mutual positions of the blocks of marks are 0.018 mm, 0.024 mm and 0.018 mm for X, Y and Z axes, while obtained RMSEs do not exceed 0.006 mm. Thus, for combinations of images taken at different angles, we obtain a fairly stable estimations of the mutual position of deformation marks. However, for maximum accuracy in real-world monitoring, it is recommended to collect images applying approximately the same camera orienting.
5. CONCLUSIONS
1. The photogrammetric crack measurer allows remote monitoring at distances from 0.1 to 40 meters.
2. There is no need to use towers and other lifting devices to perform accurate measurements in hard-to-reach places.
3. Unlike most devices, the photogrammetric crack measurer allows to track deformations not alongside one coordinate axis only, but in three-dimensional coordinate space at once.
4. High accuracy of deformation detection is provided – up to 0.005 mm; Estimation results of the photogrammetric measurement accuracy are stored in the report generated by the processing software.
5. High level of automation of the measurement system minimizes the influence of human factor.
6. The system allows to monitor cracks and deformation joints with up to 10 cm wide, and wider when using brackets.
7. When photographing under different temperature conditions, the system allows to apply temperature correction.
8. Collected imagery compose an important measurement result.
9. Application of photogrammetric methods to monitoring of cracks and deformation joints on buildings and engineering constructions is a promising approach.
References
Barazzetti, L., Scaioni, M., 2009. Crack measurement: development, testing and applications of an automatic image-based algorithm. ISPRS Journal of Photogrammetry and Remote Sensing, Vol. 64, pp. 285-296.
EOSEC Srl, GEOSEC CRACK TEST Software, http://cracktest.it/index.html (10 May 2019)
Hampel, U., Maas, H.G., 2009. Cascaded image analysis for dynamic crack detection in material testing. ISPRS Journal of Photogrammetry and Remote Sensing, Vol. 64, pp. 345-350.
Rau, J.Y., Hsiao, K.W., Jhan, J.P., Wang, S.H., Fang, W.C., Wang, J.L., 2017. Bridge crack detection using multi-rotary UAV and object-base image analysis. The International Archives of the Photogrammetry, Remote Sensing and Spatial Information Sciences, Vol. XLII-2/W6, pp. 311-318. doi:10.5194/isprs-archives-XLII-2-W6-311-2017
Sarker, M.M., Ali, T.A., Abdelfatah, A., Yehia, S., Elaksher, A., 2017. A cost-effective method for crack detection and measurement on concrete surface. The International Archives of the Photogrammetry, Remote Sensing and Spatial Information Sciences, Vol. XLII-2/W8, pp. 237-241. doi:10.5194/isprs-archives-XLII-2-W8-237-2017, 2017.
Valença, J., Dias-da-Costa, D., Júlio, E., Araújo, H., Costa, H., 2013. Automatic crack monitoring using photogrammetry and image processing. Measurement, Vol. 46, pp. 433-441. doi:10.1016/j.measurement.2012.07.019
WELTWAVE CO LTD, Dico Smartphone Crack Gauge Software, http://www.weltwave.com/new/main.php (10 May 2019)
Zheng, P., 2014. Crack Detection and Measurement Utilizing Image-Based Reconstruction. Technical report, http://hdl.handle.net/10919/48963
Revised June 2019