Photomicrometer manual
Manuals 7-03-2020, 17:17 5 199 print
Contents
Contents
Product View
Mounting Markers On The Object Observed
How To Photograph Markers
Photographing and processing multiple images (stereophotogrammetric method)
Photographing and processing single images
Types of produced Markers
Factors affecting the accuracy and validity
How To Use PhotoMicrometer
Software Settings
Creating Project
Opening Project
Saving Project
Adding Images
Deleting Images
Automatic Markers Measurement
Measurements Refining
Semi-Automatic Markers Measurement
Calculation
Strain Analysis
Report
Product View
The photogrammetric crack-metering device (photo crack meter, in short) is a hardware and software complex for high precision three-dimensional monitoring of cracks, clearance and expansion joints. The photo crack meter consists of:
➔ set of pair of photogrammetric markers - special pictures with unique numbers, printed on the plate, which are fixed along both sides of a crack or an expansion joint (Fig. 1);
➔ any modern camera with the optical zoom required for certain shooting conditions;
➔ PhotoMicrometer software.
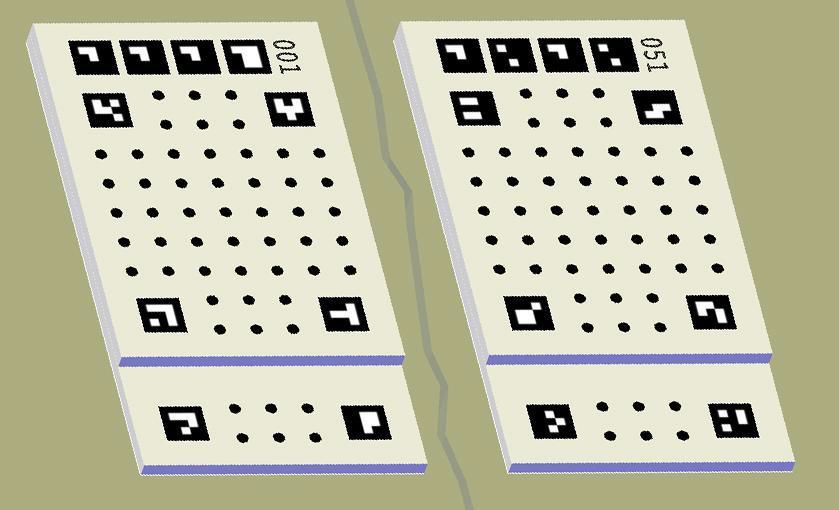
Fig. 1. The photo crack meter – two Photogrammetric markers attached on opposite sides of the crack.
The principle of monitoring is based on taking a picture of the markers by camera and using PhotoMicrometer software for photogrammetric processing of images in order to obtain a relative position of the centers of two markers in the three dimensional rectangular coordinate system (R point position in the OXYZ coordinate system, Fig. 2). The origin of the coordinate system (point O) is always positioned on the lower-numbered marker, the positive Z-axis points up, the positive Х-axis points to the right and the positive Y-axis points into the plate.
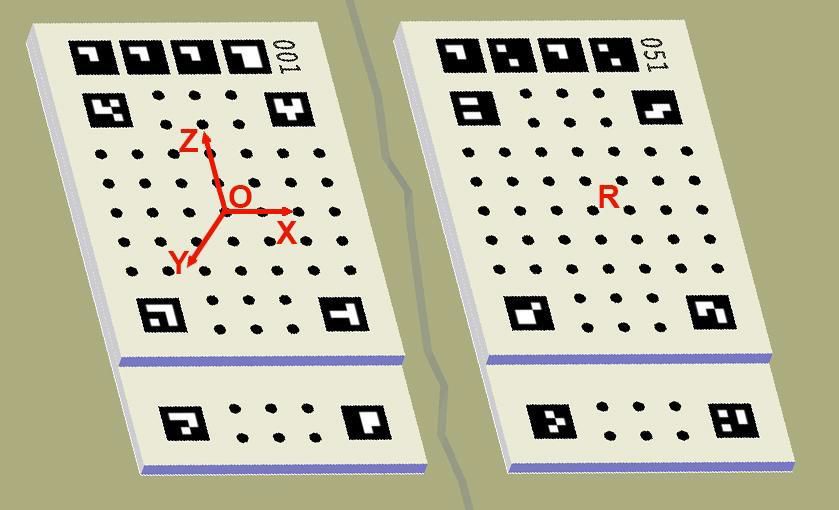
Fig. 2. Coordinate system.
Comparing the results of photogrammetric processing of images taken at different times (in different observation cycles), we determine the relative displacement of the markers.
This approach allows to monitor under different conditions (indoors, at the elevation of building, on bridges and at the industrial installations) and at different shooting distances (from 0.1m to 40m) between the camera and the object observed. Image processing in PhotoMicrometer is based on methods of photogrammetry, stereophotogrammetry, and also is based on high-precision measuring of marks. This allows to obtain displacement accuracy up to 0.005 mm and higher.
Markers are fixed on the object for the entire period of monitoring. Thus observations can be made as often as needed to analyse strain dynamics.
Mounting Markers On The Object Observed
One marker is fixed on each side of a crack, clearance or expansion joint. The marker with a lower number is mounted to the left and the other one is mounted to the right. Markers should be positioned so that the vertical axis of the markers are as parallel and close to each other as possible.
Fig. 3 illustrates markers mounting options: flat mounting on the wall (a), mounting on the inner corner of the wall junction (b) or mounting on the outer one (c).
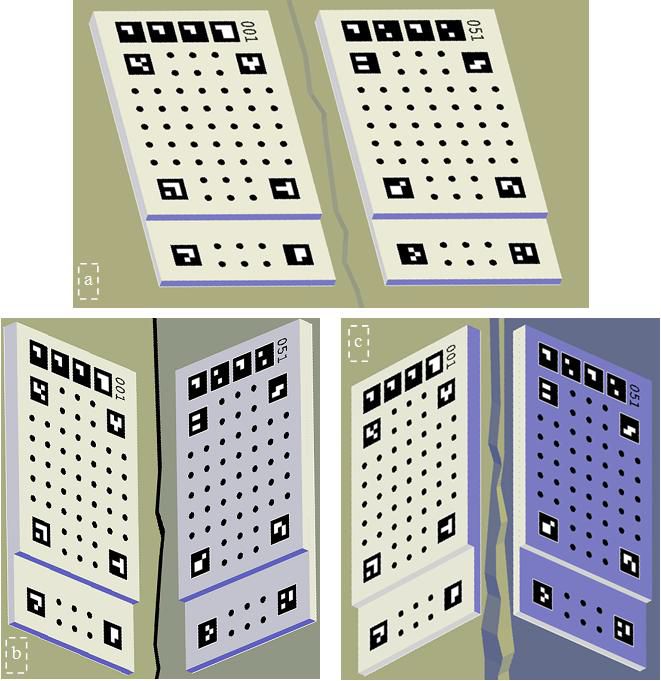
Fig. 3. Photogrammetric markers mounting options..
How To Photograph Markers
Basic rules for taking pictures of markers are:
1. 1. Markers should be photographed so that area of markers on the image was as large as possible, for example:
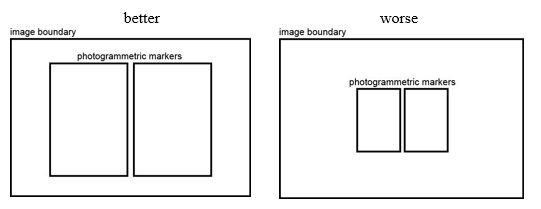
The minimum area of markers in the frame, which allows monitoring, has a ratio of 1/25 to the image area. See the diagram below:
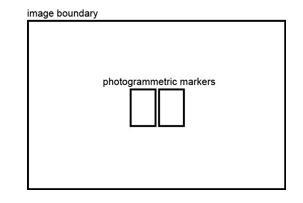
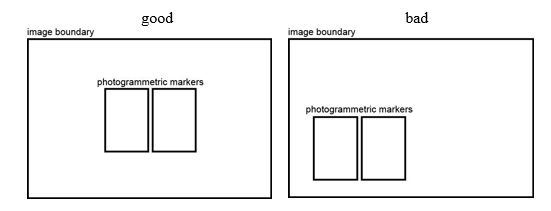
It is important that the markers are located in the center of the frame (for this it is preferable to use a tripod when shooting from a long distance):
2. 2. All square and round marks should be distinguishable on the image. The image should be clear, without blurring and with contrasting colours.
Photographing and processing multiple images
(stereophotogrammetric method)
(stereophotogrammetric method)
The monitoring cycle using Photomicrometer is as follows: first, take a picture of markers, then process images. By default, you need to take 2 or more pictures from different positions. When photographing at close range (up to 1 m from the camera to the markers), it is advisable to use the plan shown in Fig. 4а:
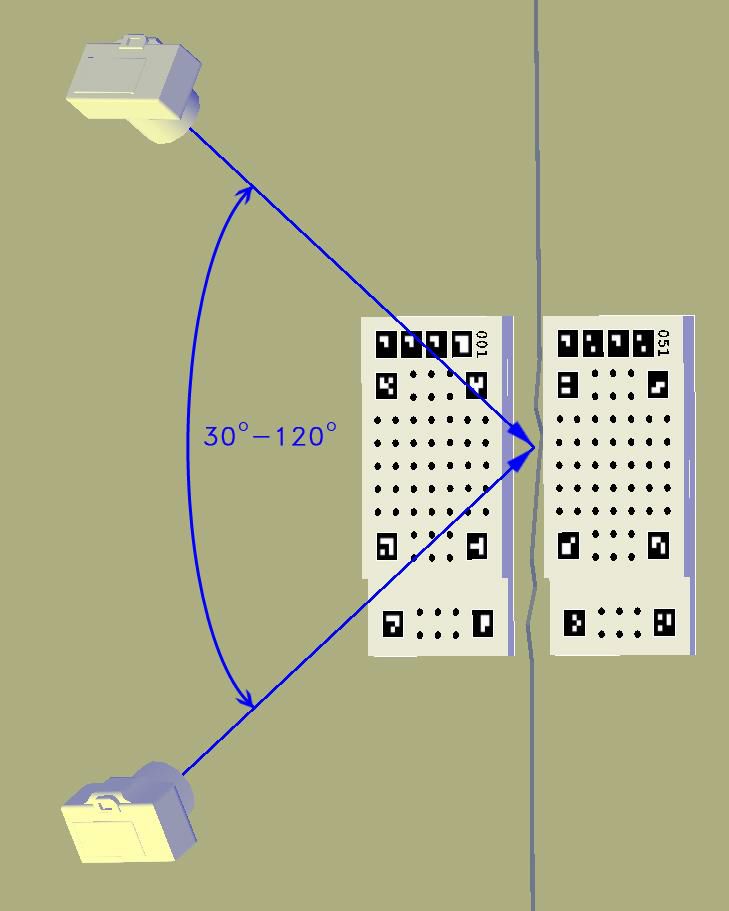
Fig. 4а. Scheme of photographing points positions and markers for long and close distances.
Cameras indicate shooting points. Blue arrows indicate shooting directions. The shooting plan shown in Fig. 4а is flexible and can be used both at long and close range.
If for some reason the plan shown in Fig. 4a is inconvenient, when photographing from distances exceed 1 m, you can use the plan shown in Fig. 4b.
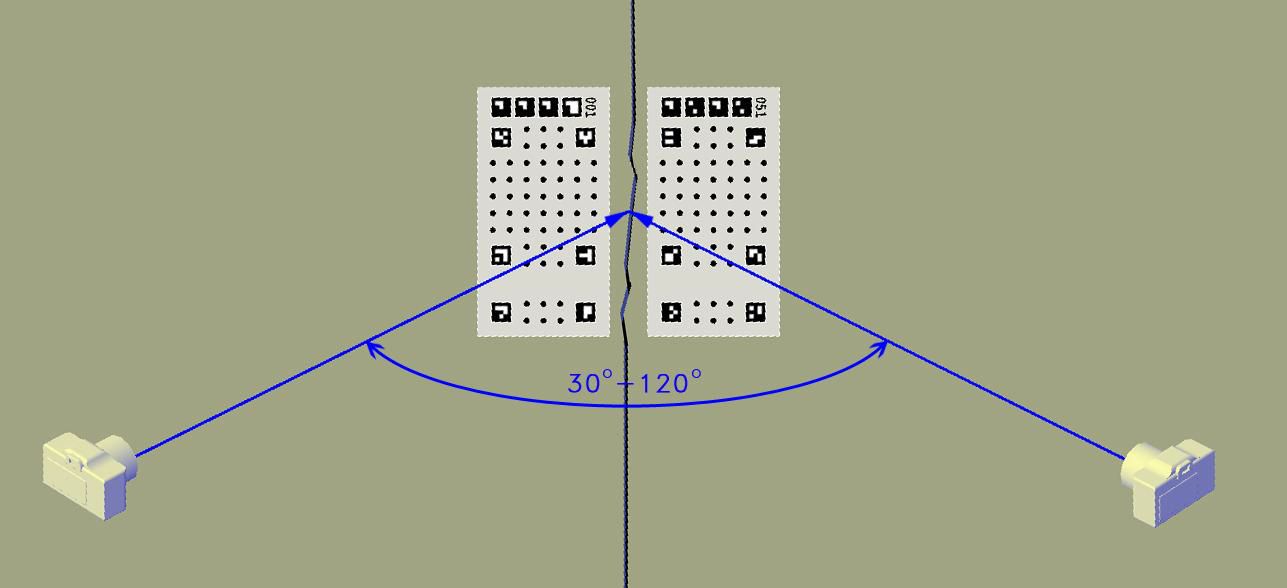
Fig. 4b. Scheme of photographing points positions and markers for long distance.
A plan of photographing markers mounted on the corner is shown in Fig. 4c.
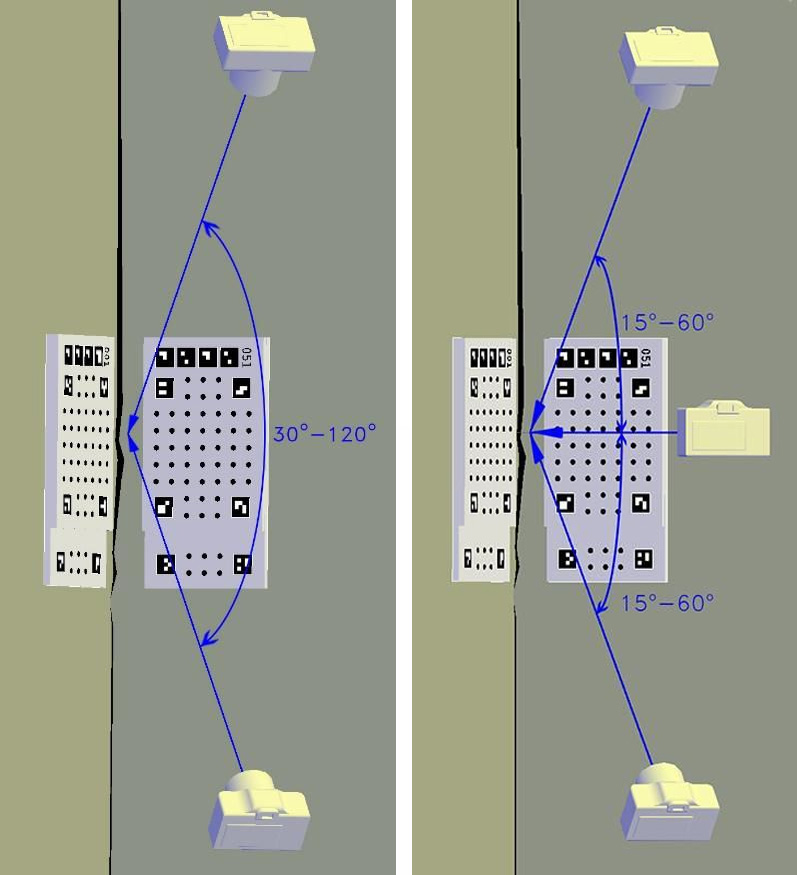
Fig. 4c. Photographing markers mounted on the corner.
Photographing should be organized so that the geometric center between markers is approximately in the center of each image. Simultaneously, the shooting points should be located at the same distance from the left and right markers. Intersection angles should be ranging from 30° to 120°. Also it is necessary that the angle between the optical axis of camera (the shooting direction) and the plane of markers should be at least 30° otherwise the validity of the results is not guaranteed.
In the case of using multiple images monitoring can be done at distances ranging from 0.1 m to 40 m. For example, markers mounted on the 1st and the 9th floor at the elevation of building can be successfully photographed from the ground. To provide the necessary image detailing, the farther the markers and the camera are located from each other the more optical zoom (focal length) should be set.
Photographing and processing single images
PhotoMicrometer allows to calculate the markers displacement using single image. In this case shooting distance should not exceed 30 cm, and the optical axis of the camera (the shooting direction) should go perpendicular to the wall plane as much as possible (Fig. 5).
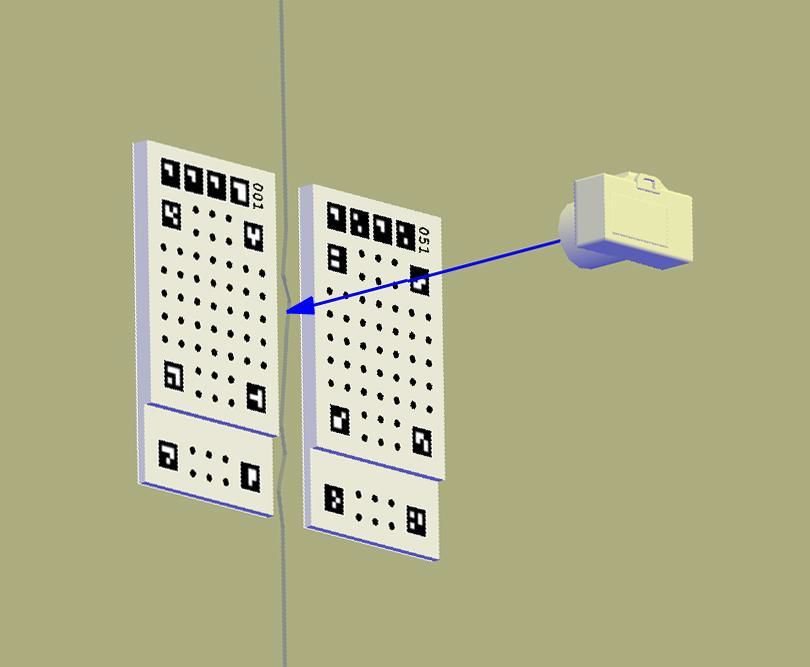
Fig. 5. Photographing markers for single image processing.
In addition, for monitoring it is necessary to use the same camera and to try to maintain a constant distance between the camera and the markers when photographing in different observation cycles.
Nevertheless, the single image calculation results are inferior in accuracy and validity to the multiple image calculation ones. So, we recommend to use multiple image calculation if possible.
Types of produced Markers
Currently, three types of markers are produced, designed for different indicators of determination accuracy.
| № | Marker Type | Accuracy |
| 1 | М-0.1 | 0.1 mm |
| 2 | М-0.02 | 0.02 mm |
| 3 | М-0.005 | 0.005 mm |
The value of the root-mean-square error in determining the mutual position of the centers of two markers was taken as a measure of accuracy, obtained from processing a pair of images taken at a distance of 2 meters and with an intersection angle of 90 ° (Fig. 4a and 4b).
Markers of different types look the same. The differences are in the accuracy and, accordingly, the complexity of the program for their calibration, the results of which are recorded in the calibration file and supplied with the markers.
Factors affecting the accuracy and validity
In addition to the type of markers, the accuracy and reliability of the results obtained is influenced by a number of factors that must be taken into account when photographing.
The accuracy and validity of calculation results depends on the number of images and shooting positions. Therefore, increasing the number of images and the number of shooting positions is one way to increase the accuracy and validity of the results.
The best shooting positions for multiple image calculation should be such that the intersection angle between the left and right cameras (Fig. 4b) or the upper and lower cameras (Fig. 4a, 4c) is in the range from 90° to 110°.
When shooting from different distances, it is necessary to use cameras with lenses that provide sufficient image magnification to obtain the dimensions of the markers images as shown on page 4. The relationship between the shooting distance and the required focal length of the camera is presented in the form of a table:
| Shooting distance (m) | 0.2 | 1 | 5 | 10 | 20 | 30 | 40 |
| Equivalent focal length of the camera (mm) | 14–55 | 40-200 | ≥200 | ≥400 | ≥800 | ≥1200 | ≥1600 |
The equivalent focal length of the camera is given in terms of the 36x24 mm frame format for matrices with a resolution of 15 - 20 megapixels.
For shooting distances exceeding 2 meters, it is advisable to use a tripod.
To obtain high-quality images suitable for image processing, photographing should be done when the markers are evenly illuminated, best of all in cloudy weather with diffuse lighting. The presence of unevenly illuminated areas and glare in the images of the markers is not allowed.
PhotoMicrometer allows you to take into account the thermal expansion of the markers. To do this you need to enter the temperature of the moment of photographing in the application. When photographing in sunny weather, remember that the actual temperature of markers in the sunlight can be substantially different from the air temperature.
In places with insufficient light you can photograph the markers using the flash, but you should not shoot at direct angles to the markers to avoid glare in the image.
In order to ensure the most reliable and accurate monitoring results you should follow a few simple rules in each monitoring cycle:
➔ take pictures with the same camera;
➔ take pictures from the same shooting points;
➔ calculations should be made with the same number of images.
How To Use PhotoMicrometer
Software Settings

When clicking the software symbol a context menu appears, in which you can select the following items: Settings, Help, About, Recent projects.
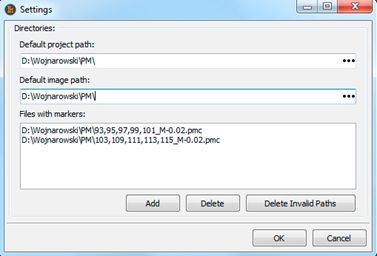
In Settings you can set directories for saving projects and user images.
In addition, the calibration files of the corresponding markers with the *.pmc extension must be loaded into the “Markers files” window. Loading new calibration files is performed by clicking the “Add” button and selecting the appropriate file.
Creating Project

The project stores the date of one observation for one pair of markers. The user should name a new project. After that the user will be prompted to add images to the project. You can skip this step and add images later.
Opening Project

Select an existing project file. If another project is opened user will be asked to save the unsaved changes if they exist and after the current project will be closed.
Saving Project
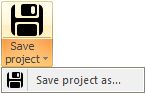
Automatic project saving option is not provided in the application. All the project changes are stored in the Photomicrometer memory and will be saved to the hard disk only when using Save project or Save project as. Selecting Save project as you can re-save the project under a different name, in this case the data of the previous save will not be overwritten, and work with the new saved project will continue.
Adding Images

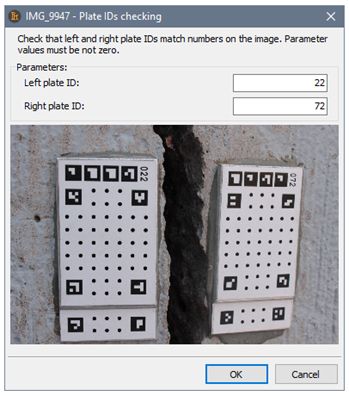
When adding images, you can select one or more images. The application automatically recognizes marker numbers. After loading the first picture, a window appears to check the accuracy of the loaded markers image. Only images with the same markers can be added to the project (the numbers of the left and right plates on the images in the project should be the same). This window will also appear if marker numbers are not recognized or are recognized differently than the markers on the first image in the project. The user can set the numbers manually or cancel adding the current image to the project.
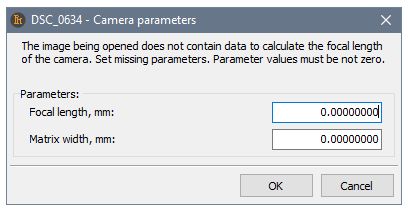
The application automatically reads from the image the necessary information about the camera (focal length, camera matrix width) and verifies that the pictures were taken by the same camera. Therefore, the parameters of subsequent images to be added should be the same as in the first image in the project otherwise an error message will be displayed.
Some cameras (usually mobile phone cameras) do not write the necessary information into the image file. In this case the user will be asked to enter the missing data manually. This can be the camera matrix width in millimeters or the camera focal length in millimeters or both.
Deleting Images

Deleting the current image from the project.
Automatic Markers Measurement
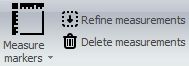
Measurement of marks on the current image is started by clicking the Measure markers button. By clicking the little triangle, you can select Measure markers on all pictures to measure marks on all images in the project. During measurement, progress is displayed on the Measurement control panel and the stop button is active (black square) to interrupt the measurement. After measuring is finished click the Refine measurements button to check the results.
If the quality of measurements does not satisfy the user, then there is a manual setting up of measurement parameters.
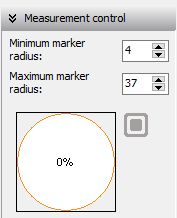
Automatically calculated values of minimum and maximum mark radius in pixels are displayed on Measurement control panel. By changing the radius of the mark you can customize the mark measurement.
The user can also delete measurements on the current image by using Delete measurements.
Measurements Refining
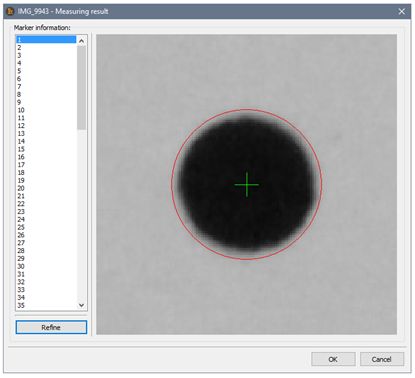
The latest measurement results will be shown in the window that appears: mark number, enlarged mark image, preliminary mark center (yellow cross), found mark center (green cross) and calculated mark radius (red circle). The user can use the mouse wheel to change the radius of the mark and can move the image while holding the middle mouse button and then Refine the measurement of the center of the mark. In most cases, automatic measurement works well and does not require manual customization by the user.
Semi-Automatic Markers Measurement
a / b / c / d
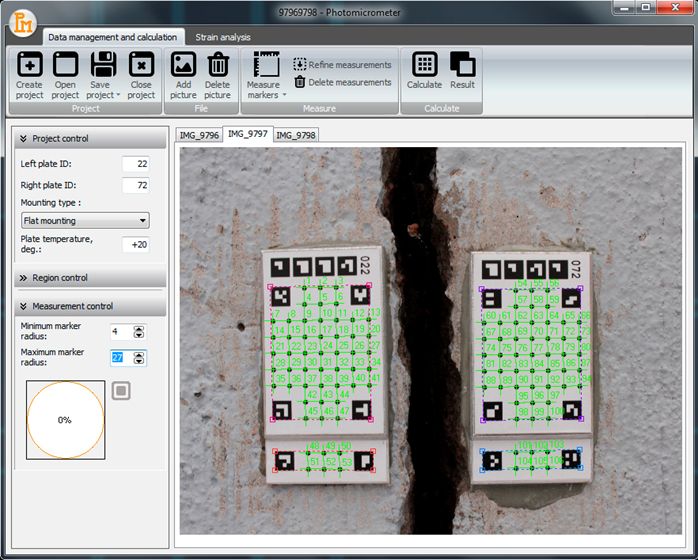
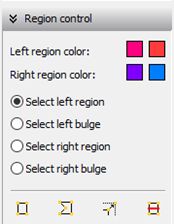
The shape and position of regions on the image also affect the quality of the mark measurements. Usually they are automatically detected well, but sometimes in not very good shooting conditions, when the pictures are not very clear or taken in poor lighting, the automatic region detection fails. In such cases you need to manually specify or correct the regions. There are 4 marks regions: the left region, the left bulge, the right region and the right bulge. You can set the colour for every region on the Region control panel. To change region, you need to select it in the list, for example Select the left region, and then select the command for working with the region. Create rectangle (a) creates a rectangular region on the image all lines of which are parallel to the sides of the image. Create polygon (b) allows you to specify a quadrangle of arbitrary shape. Move vertex (c) allows you to change the shape of an existing region. Delete region (d) removes the region from the image. To start measuring marks, you need to have all four regions, which are quadrangles, whose vertices are the outer corners of the square marks. Only one region of each type is allowed on the image, therefore, when you try to add the region that is present on the image, the region is replaced. A correctly measured markers are shown in Figure 6.

Fig. 6. Correctly measured markers.
Calculation


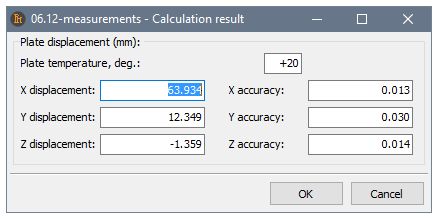
Calculation is available when marks are measured on all images in the project. The application works with 3 ways of mounting the markers: flat mounting on the wall, mounting on the inner corner of the wall junction or mounting on the outer one. Before starting the calculation, you need to select the mounting type as well as markers temperature at the time of shooting on the Project control panel. If the calculation is successful, a window with the calculation results will be displayed. Later the calculation result can be viewed by clicking the Result button.
Strain Analysis

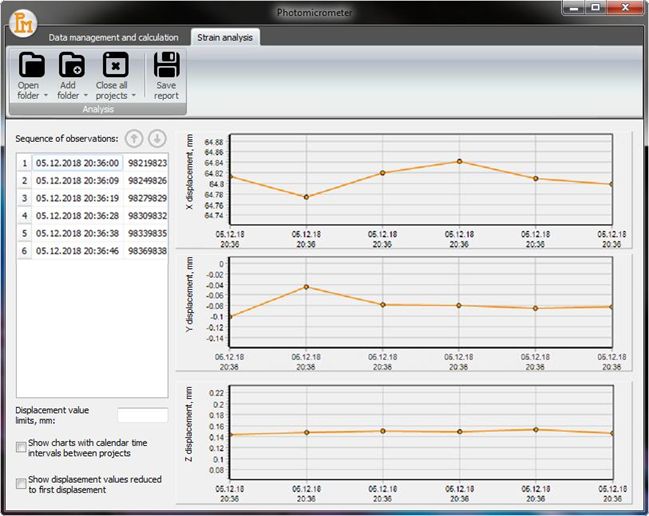
The user can open the directory with projects or one project, and also add other projects to open projects. The list of projects will be shown in the table Sequence of observations.
By default, the sequence of projects corresponds to the date and time of observations (taken from EXIF image data). The user can sort the sequence of projects in the list and on the charts. You can close the project selected in the list or all projects at once. After opening the projects, displacement charts will be shown in the window.
The charts show all the displacements of the markers from the listed projects along the axes X, Y, Z. The value axis scale is automatically calculated and the axis limits are displayed to the user in the Displacement value limits field. This value can be edited to change the chart view, but it cannot be lower than the calculated minimum for the given list of projects. The chart scale can be changed by moving the mouse down and to the left on the chart while holding the left button, and returning to the original scale - moving up and to the right. Two types of horizontal axis can be selected - uniform scale or time bar (check Show charts with calendar time intervals between projects). By default, the charts will show the absolute values of the center of the right plate relative to the center of the left one in different observation cycles. If desired, the absolute values can be replaced by displacements in relation to the first observation cycle or the first open project (check Show displacement values reduced to first displacement).

The user can save the calculation results to the report in HTML format or in text format.
Report
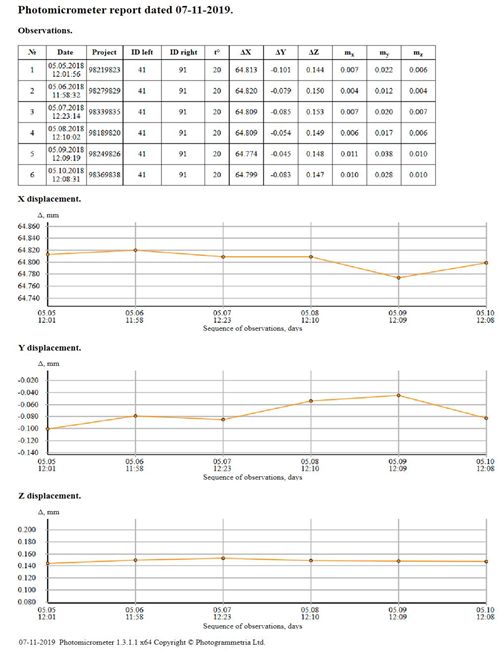
The ordinal project number is recorded in the first column of the table. The date and time of shooting is recorded in the second column. The name of the project is recorded in the third column. In the fourth and fifth columns there are the numbers of the left and right markers. The temperature of the markers during shooting is recorded in sixth column. The markers displacements are recorded in the seventh, eighth and ninth columns (X, Y, Z). The last three columns contain the displacement accuracy - mean square errors of the corresponding displacements in millimeters. These estimates are obtained from the adjustment of photogrammetric measurements and are indicators of their internal convergence. Data from the table can also be saved as a text file.
 Download Photomicrometer manual (english)
Download file: photomicrometer_manual_2020_eng_.pdf [1,47 Mb] (Number of downloads: 58)